Rendering Maps at Scale: Bridging OpenLayers and PixiJS
How we wired a WebGL rendering pipeline into a geospatial map using PixiJS and OpenLayers

The Problem
When building a meteorological map application, you quickly run into a rendering wall. You need to display thousands of data points — wind barbs, temperature gradients, animated streamlines — all on an interactive map that users can pan, zoom, and step through time.
SVG works fine for a few hundred elements, but falls apart at larger scales. Canvas 2D is faster, but redrawing everything on every frame becomes a bottleneck. The natural next step is the GPU.
This post walks through how we extended OpenLayers — a library for displaying interactive maps in the browser — with a custom WebGL rendering pipeline, using PixiJS to handle the GPU side. PixiJS is a 2D rendering library that normally draws to its own canvas, but here we use it differently. It is less about the final visuals and more about the plumbing that makes it work.
The full source code is on GitHub.
Here is what the end result looks like — wind rendered as barbs and as streamlines:
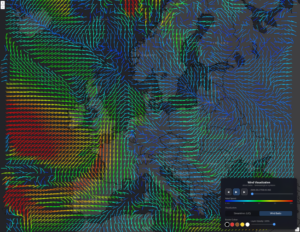
Wind barbs — each arrow shows wind direction and speed at a grid point
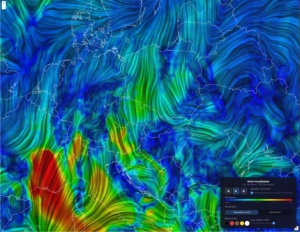
Wind streamlines — continuous lines that follow the wind flow
1. Keeping Concerns Separate
OpenLayers structures its rendering around three abstractions: a source that fetches data, a layer that owns the source, and a renderer that draws pixels. We extend all three.
To keep the code manageable, we split the renderer into two classes. The renderer handles OpenLayers‘ lifecycle — it knows about frames, caching, and when to trigger a redraw. The detail class does the actual drawing and has no knowledge of OpenLayers at all.
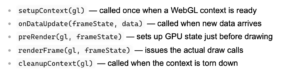
The detail class follows a simple interface ( renderer-detail.ts ):
 Each concrete layer type — like WindbarbLayer — only needs to wire these pieces together. The drawing complexity lives in its detail class. See also custom-layer.ts, custom-source.ts and custom-layer-renderer.ts.
2. Injecting PixiJS into an Existing WebGL Context
Normally PixiJS creates and owns a <canvas> element. Here we flip that: we create the WebGL2RenderingContext ourselves and hand it to PixiJS. This way we stay in control of the canvas, and PixiJS just borrows it ( pixi-layer-detail.ts ):
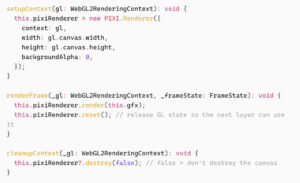
This gives us the full PixiJS scene graph — Container, Graphics, Mesh, Shader, Texture — on a context we share with our own GLSL shaders. PixiJS takes care of buffer uploads and texture binding. We stay in control of the canvas.
3. The Offscreen Render Queue
This is where the main performance gains come from.
WebGL rendering only needs to happen when data changes. Panning and zooming are just coordinate changes — they do not need the GPU to redraw anything. So we separate the two:
- When data changes, render onto an OffscreenCanvas and save the result as an ImageBitmap
- On every frame after that (pan, zoom, resize), draw that saved image onto the visible canvas using a simple coordinate transform
The key design decisions in offscreen-renderer-queue.ts :
– One shared offscreen canvas for all layers. Multiple layers cannot use the same WebGL context at the same time, so they share a single canvas and take turns.
– Jobs run one at a time, never at the same time. We use RxJS concatMap to make sure render jobs are processed one after another.
– Pixels are handed off without copying. transferRoImageBitmap() gives ownership of the pixel buffer to the bitmap directly.
Once a frame is rendered and saved, every pan or zoom is just a single ctx.drawImage() call — no GPU work at all. On top of this, an LRU cache ( lru-cache.ts ) stores previously rendered frames so stepping back and forth through forecast time steps requires no GPU work either.
4. Encoding Grid Data as GPU Textures
Wind data is stored as two separate grids: U (the east-west component) and V (the north- south component). Together they describe both the direction and speed of wind at every point. For example, a strong U value with a small V value means the wind is blowing mostly east or west.
Weather grid data — say, wind U/V components across a 200×150 grid — arrives as JavaScript Float64Arrays. Sending 30,000 individual float values to the GPU as vertex attributes is not practical.
Instead, we pack the data into a GPU texture. Each grid point becomes one pixel, with the U and V wind components packed into the four color channels (R, G, B, A), two bytes each. The vertex shader then reads each wind value by looking up that pixel in the texture. The decode is one line of GLSL ( windbarb-renderer-detail.ts ): The GPU reads and processes all 30,000 wind values in parallel, with no per-frame CPU work. The full encoding logic lives in data-texture.ts .
Putting It All Together
Here is the flow from new data arriving to pixels on screen:
1. Source params change → new grid data is fetched from the weather API
2. Data arrives → the detail class updates the GPU texture and renders to an ImageBitmap via the offscreen queue
3. Image is cached → stored in the LRU cache by time step, viewport size, and position
4. Map moves → OpenLayers calls renderFrame() on every interaction, which is just a fast drawImage() with a position transform
Steps 1–3 are async and only run when data changes. Step 4 runs on every animation frame and is cheap.
Closing Thoughts
This setup is not specific to weather data. The same approach works for any layer type where you need GPU rendering on an interactive map: point clouds, heatmaps, custom vector overlays.
The setup takes some effort, but once it is in place, adding a new layer type means writing one detail class and a few shaders
— the rest takes care of itsef